Filters in Analysis (part of Flowmon Monitoring Center) are a very powerful feature which allows us to get the information we are looking for or just to analyze what is happening in the network. Previously, we've explored DNS Communication of Servers. Today, let’s investigate one of the workstations in our network. We want to find out which domain names this workstation requested. This can help us uncover malware or other malicious/undesired activity.
Navigate to Flowmon Monitoring Center (FMC) → Analysis. Scroll down to Advanced analysis and switch from the Statistics tab to List of flows.
Create a new output "DNS_extended" and include the following DNS fields:
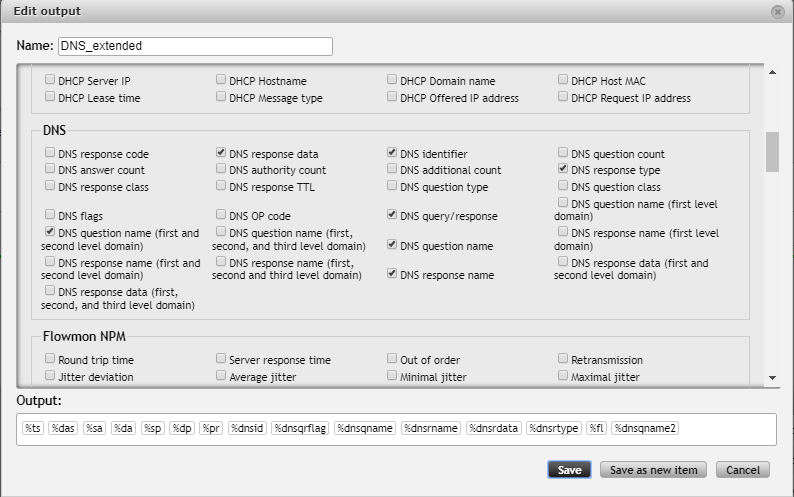
In our List of flows tab set the limit to 100, aggregation by “DNS question name”, sort by the number of flows and choose previously created output.
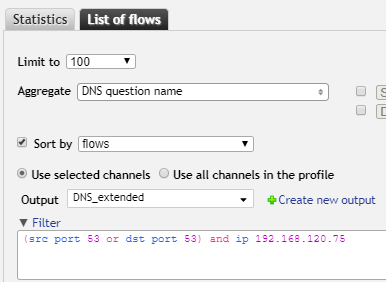
Select all the DNS communication (port 53) for a specific address in our filter:
port 53 and ip 192.168.120.75
It’s clear that we'll need to adjust our filtering, because the results are full of requests for Google services (to be expected, since Google Apps are used within the company). And we can already deduce that the user is probably using Firefox.
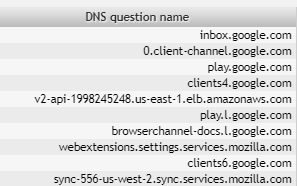
If we look at the column DNS question name (first and second level domain),"%dnsqname2" in Output, all of these DNS requests for Google services have the same second level domain "google.com".
We can filter all requests to *.google.com with the dns-qname2 expression:
dns-qname2 "
Our filter:
port 53 and ip 192.168.120.75 and not dns-qname2 "google.com"
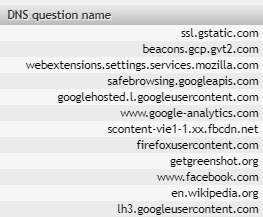
After excluding "google.com" there are still some Google domains left. And we can already see that the workstation requested getgreenshot.com, facebook.com and wikipedia.org.
It's clear that this approach would be a bit cumbersome, because we would have to include "port 53" in the filter every time we want to show DNS communication. We can create a new DNS profile for convenience.
;More information about Profiles can be found in the Flowmon User Guide, Chapter 7.5 Profiles Page and in our blog post Get The Most Out Of The Profiles In Flowmon Monitoring Center.
Navigate to FMC → Profiles → Edit profiles and click on the button to create a new profile. Apart from configuring the basic profile settings we also need to create a new channel. This is where we are going to use filtering again (we want only DNS communication without Google domains):
port 53 and not dns-qname2 "google.com"
Optionally, expand the filter to exclude even more Google domains (filters can span multiple lines):
port 53 and not dns-qname2 "google.com" and not dns-qname2 "googleusercontent.com" and not dns-qname2 "googleapis.com" and not dns-qname2 "gstatic.com" and not dns-qname2 "google.cz" and not dns-qname2 "gvt2.com" and not dns-qname2 "google-analytics.com"
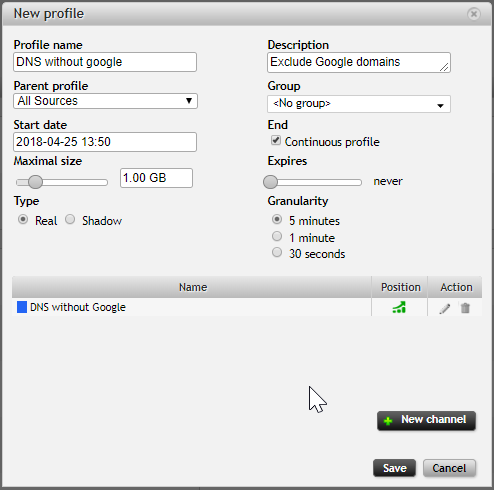
After we save the profile, we can see it on the Edit profiles page:

When we open a profile's existing channel for editing, we can see that the port number 53 automatically gets converted to a text string "domain" for convenience.
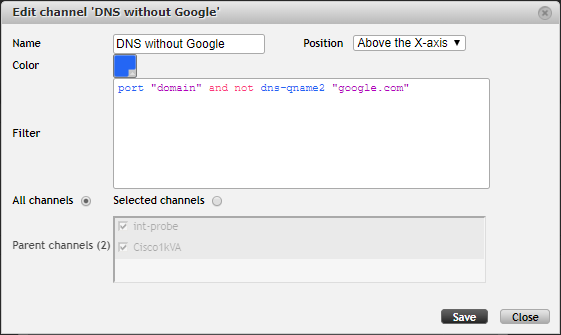
Go back to FMC → Analysis and change the profile on the top of the page to our newly created DNS profile.

It's important to always check your profile! Any amount of filtering can already be applied in a profile. If you are not sure, hover over the channel name to reveal the tooltip with details:

Scroll down to Advanced analysis and switch from Statistics tab to List of flows. Again, set the limit to 100, aggregation by “DNS question name”, sort by the number of flows and choose the output that includes the relevant DNS fields.
Our filter can be simplified, since we have already applied filtering in the profile:
ip 192.168.120.75
We can keep adjusting filtering for our convenience. By looking at the results we can quickly see what other applications and pages the user has used/visited (rescuetime.com, evernote.com, dropbox.com and flowmon.com).
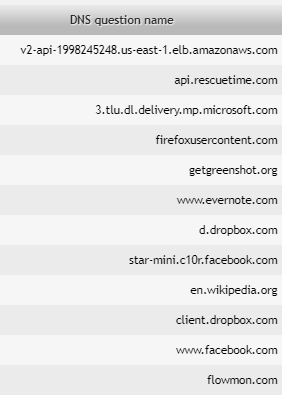
Since we are showing only the top 100 flows, we can only see the most often used apps and web pages. Let's look at some more results.
In the List of flows change the limit to 10 000. Optionally, aggregate by "DNS question name (first and second level domain)" - this will lead to fewer results, since we are aggregating together all the DNS requests from the same domain.
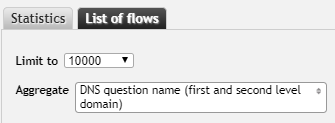
The results now probably span multiple pages. One way to find irregular DNS requests is to navigate to the last page (37 in our case) and browse through the results from the back.

We can find suspicious sites such as s.w.org, redhelper.ru or alemoney.xyz. The first one is just a short domain name for wordpress.org, the second is a live chat system for websites, and the last one has been known for crypto-jacking.
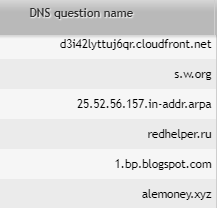
Our investigation has paid off. We can investigate the crypto-jacking case further (learn more about crypto-jacking in our previous post).
We have an online demo, go ahead and try what you've learned today! Download our free trial and start with flow monitoring in your network!